High Dimensional Data Visualization
I attended a seminar on large scale visualization and wrote a paper on high dimensional data visualization, comparing different techniques. A key concept of high dimensional data visualization is dimensionality reduction, in order to reduce the number of dimensions to be visualized. The paper covers linear (principal component analysis) and non-linear (local linear embedding, ISOMAP, t-SNE) dimensionality reduction techniques. The paper has been peer-reviewed in class.
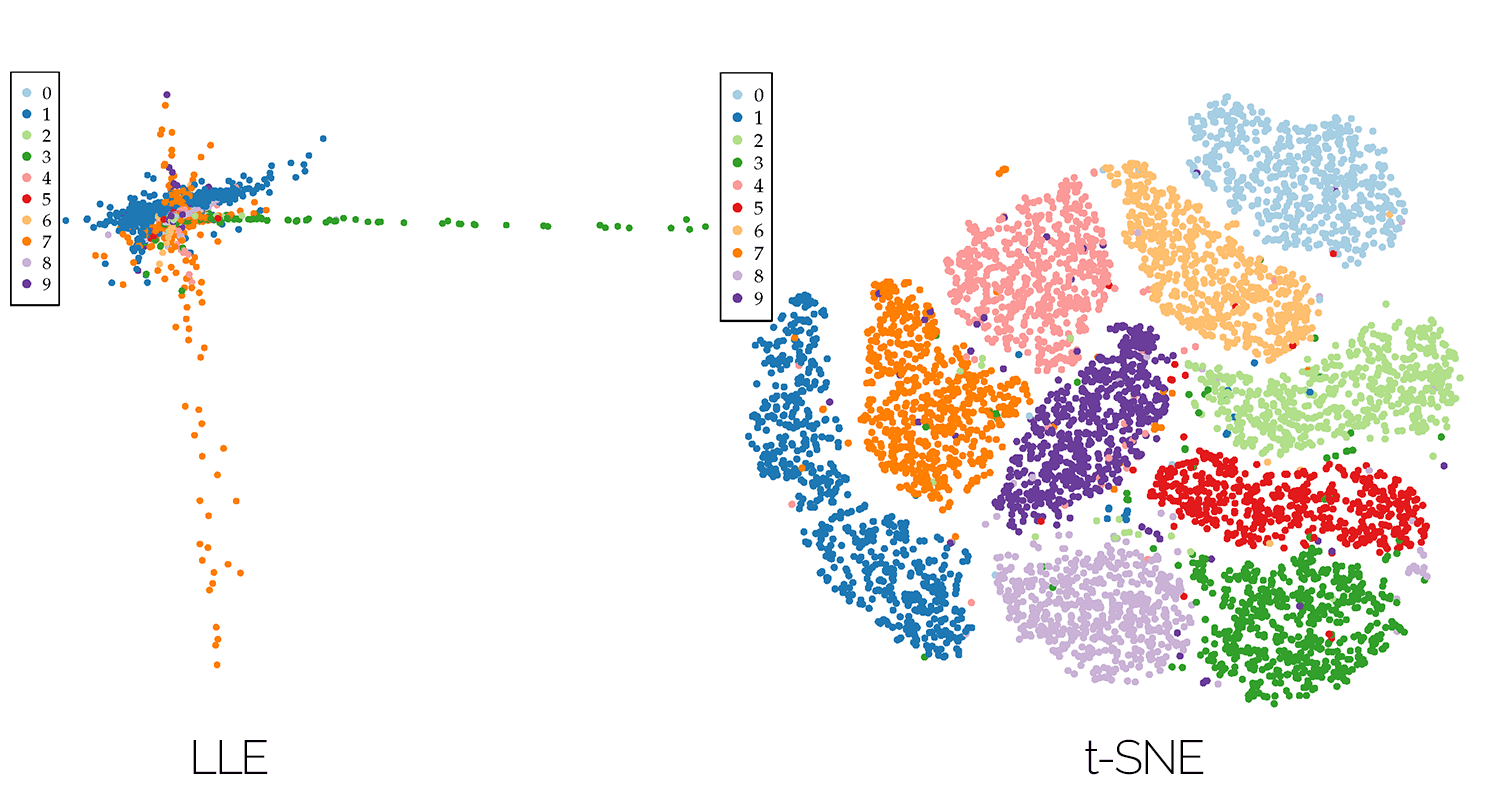
The title photo is a visualization of the MNIST dataset - a database of handwritten digits. The R language was used to create the plots.
Paper Abstract
The data gathered in various scientific domains and industrial applications is steadily growing in size. What today seems to be large-scale may become small-scale in five to ten years. The size of the data increases in both, data set size and the number of measured or simulated variables of a single datum. However, the increase in the size of the data leads to an increased complexity when dealing with such data sets. On the one hand the large-scale data needs to be processed within reasonable amounts of time while on the other hand, the perception of the human being analyzing data can only deal with a certain complexity limited by perception. For the latter, it is inevitable to reduce the complexity of the data. A commonly chosen method in applications such as compression, classification or visualization is to reduce the number of dimensions of the data. Dimension reduction techniques aim to compute a data set with fewer dimensions based on the original data, that still represents patterns and characteristics of the original data.
Presentation
Download
You may download a copy of the paper here:
Download: High Dimensional Data Visualization